28 Feb 2021

Save for everything all the time: an ‘EMI life’

I started goal-based investing only last year. A full 15 years after I started working full-time. This is a late start for sure, but better late than never.

I jotted down a total of 19 financial goals and made a plan for how much I’ll invest towards each goal. I was feeling proud about this for a while, but soon realised that this plan resulted in a bad liquidity crunch for me. I pretty much invested everything I was earning and I didn’t have much money left for even semi-essential day-to-day expenses. I tweaked the plan to improve the cash flow, but I was still falling short. Then I realised that big ticket short-term expenses were the biggest shock to the system, and I started saving for some of these expenses.

While I saved for some expenses, others were simply forgotten. I was saving for my 2 children’s school fees, but I had failed to save for the medical expenses for the birth of my 3rd child. Nor was I saving for the school admission fee for my 3rd child. My calculations show that I need to step up my savings significantly to meet these school expenses. I realised that the plans that I was so proud of were severely incomplete.

Saving for children’s school expenses significantly increased the amount of money I had to keep aside every month, but I was still able to remain afloat. Today I was thinking about our old car and it dawned on me that we’ll need to replace this car in a few years. I need to start yet another monthly saving to fund the car purchase when the time comes! 😟

Thinking more, I realised that I should be saving for everything all the time! When should I start saving for a new car? As soon as I have paid off the current car loan. When should I start saving for my child’s 2022-23 school fees? As soon as I have paid the 2021-22 school fees. Sort of like having to pay half a dozen EMIs indefinitely. If I don’t to do that, I am going to be unprepared when these big ticket expenses do inevitably come.

•••

One of the simplest but very effective ideas for behaviour change is to start small. Just do one thing right, or change a tiny part of your day for the better. As time goes by, that change will spill over to other parts of your day and your life improves beyond the initial change that you made.

I am seeing such a change in the way I manage money. What started as a plan that covers my crucial long-term financial goals has spilled over to more and more of my less crucial but still important goals/expenses.

The revelation about having to buy a car in a few years came today. I have entered the goal into Kuvera without a plan for where the money will come from. This is definitely overwhelming and I am frustrated that expenses are piling up. At the same time, a part of me understands that uncovering such holes in my plan is a good thing. The more holes I uncover, the more holes I can plug. The more holes I plug, the fewer financial shocks our family will have to endure.

Like they say, the more you sweat in peace, the less you bleed in war. I intend to win the ‘personal finance’ war without bleeding (much).

26 Feb 2021

What companies are in Kuvera recommended portfolio?

What is a market-cap weighted index fund? Let’s say you are investing ₹1,000 in a typical Nifty 50 index fund. Where does your ₹1,000 go? It’s split between the shares of the 50 constituent companies in the index. But how much money is spent on each company? That’s determined by their market cap.

As I am writing this post, HDFC Bank takes up 10.29% of the index, Reliance Industries takes up 10.13%, and so on (source). In other words, ₹102.90 from your ₹1,000 is spent on HDFC Bank’s shares, ₹101.30 from your ₹1,000 is spent on buying Reliance Industries shares, and so on. Basically, you are buying 50 companies, but the larger each company is the more you spend on it.

Another way to think about this is to equally distribute the ₹1,000 to all 50 companies at ₹20 per company. Then, take a part of the money allocated to smaller companies and use it to buy more of the larger companies. This is a popular way of deciding how much money to put in each company. So popular, in fact, that this is the “default” way index funds allocate capital.

Mutual fund schemes recommended by Kuvera

I am a Kuvera customer, and I invest in the portfolio recommended by them. Kuvera recommends 3 funds for domestic equity and 1 fund for US equity. Let’s keep aside the US fund and focus on the 3 domestic funds. We have a market-cap weighted Nifty Next 50 index fund, an equal weight Nifty 50 index fund, and a focused fund. The focused fund states that it’ll allocate at least 65% of the money in companies chosen from the first 100 companies, i.e. constituents of the Nifty 50 and Nifty Next 50 indices (see screenshot below).

So, what does it mean to invest in the 3 funds recommended by Kuvera? It means you are mostly investing in the largest 100 companies in India.

  • You allocate more or less equal amount of money into each of the 50 companies in the Nifty 50 index (because this is an equal weight index fund).
  • You buy Nifty Next 50 companies according to their market cap, but the Next 50 index has a much less concentrated portfolio than the Nifty 50 index. The largest weight in this index is 4.45% (compared to 10.3% in the Nifty 50). So your money is a bit more evenly spread across the 50 constituents.
  • Now you add the focused fund. That increases your exposure to a subset of these 100 companies according to the fund managers’ judgement. It can also add exposure to companies beyond the first 100 companies, but that would be a maximum of 10% of your equity portfolio (28.5% is allocated to the focused fund; the focused fund can allocate up to 35% in companies outside the Nifty 100 index).

After having invested in this portfolio for a year, I think I understand what companies I am investing in. I still haven’t figured out the ratios: why 45.7% in Nifty Next 50, why 28.5% in the focused fund, etc. Hopefully I’ll understand that in some time.

20 Feb 2021

My portfolio does not have gold anymore

I am a new investor. I started goal-based investing only in Jan 2020. (Big thanks to Kuvera for introducing me to investing discipline!) I had bought into the idea that gold brings stability to the portfolio, so I had an allocation for gold.

The more I looked at gold, however, it became clearer that gold does not really add much to my portfolio. The gold price chart below was the ‘convincing evidence’ that I was looking for. It’s clear from the graph that for many years gold simply sits there without appreciating in value!

Gold price in INR in the past 10 years (click to enlarge)

That was bad enough for me, but it actually gets worse. Gold is bought and sold in the international market in USD. During this 10 year period, INR depreciated in value compared to USD. So gold must have lost value during most of the time represented in this graph. Looking at the price in USD confirms that from late 2012 to 2016, there has been a big fall. And then it sits idle for 3 years. (Both price graphs taken from goldprice.org.)

Gold price in USD in the past 10 years (click to enlarge)

It was an easy decision. I did not want to sell equity and buy gold when it was time to rebalance. I immediately stopped buying new gold, but I held on to the gold I had already bought. Let it sit idle for 3 years, I thought, so when I sell I’ll qualify for long-term capital gain. Yesterday, I realised that this was just Status Quo Bias (or maybe Sunk Cost Fallacy?). I would be better off if the same money was invested in assets that are better aligned with my preferences. So I sold all the gold.

Feeling good about having made the (apparently) tough call to let go of an asset, and also for having decluttered the portfolio by a little bit.

Update: I made a follow-up post going over more reasons behind my decision to exit gold.

19 Feb 2021

Visualising how interest rate movements affect debt fund yields

I have been thinking a lot about the debt part of my mutual fund portfolio. Because I follow Kuvera’s recommendations, I started off with a liquid fund as recommended by Kuvera. But I am always trying to find a debt fund that provides better returns without compromising too much on stability. I don’t want to invest in AA or lesser quality debt; I don’t want to invest in debts with longer durations such as 3 years or 5 years; I don’t want those risks. I want the volatility to be pretty much nonexistent while providing a better return than liquid funds. (Let’s keep aside the discussion of whether I should look beyond liquid funds at all.)

My natural first move was to look at Ultra Short Term (UST) debt funds. After looking at the portfolios and past performances of a few UST funds, I picked 2 funds for my portfolio. Though they have been my only debt instruments for many months, my fascination with debt funds is unceasing. I keep looking at other fund categories (such as Short Duration funds, Conservative Hybrid funds, etc) and considering if they are better than the UST category. It’s hard to tell just by looking at few months’ fact sheets and recent returns.

My confusion has increased due to the low bond yields for close to a year now. Liquid funds that used to give 6% returns are down to 3%; UST funds that used to give 8% are giving only around 4%. Other fund categories, such as corporate debt funds and short duration funds seem to be doing well even after the interest rate was reduced. Should I be switching to some other debt category? Maybe I should temporarily switch to a different category until the interest rates go up again? So many questions, but no easy answers anywhere. ValueResearch provides some insights into the risk and return characteristics of funds, but even that seems insufficient to tell whether it’s a good idea to move away from the UST category.

This is when I discovered the usefulness of historical rolling returns. The graph below is particularly insightful (graph screenshot taken from RupeeVest.com) and gave me the answer I was looking for.

Historical 1 year rolling returns of an Ultra Short Term debt fund and a Short Duration debt fund (click to enlarge)

The most interesting part for me from this graph is how the trajectory of the 2 lines are often in opposite directions. In 2009, the UST fund’s yield has started to go down and begins to go back up by late 2010 before getting back to older levels in 2012. How did the Short Term (ST) fund do during this time? The ST fund’s yield shot up when the UST fund’s yield went down; when the UST fund started recovering, the ST fund fell! Eventually, in 2012, both funds have caught up. The rise and fall of the UST fund is much smoother than the ST fund’s sharp rise and fall.

I think this is the key to understanding how these funds react to changing interest rates: UST yields go down quickly and recover quickly when the market interest rate changes. ST fund has a period where it enjoys higher yield when rates go down (due to the longer duration of the debts it holds), but suffers a fall on the other side when the market rates go up again (again, due to the longer duration of the underlying debts).

Look at the extreme right end of the graph: UST yield keeps on going down but the ST yield is staying above with 3+ percentage points better return. (In fact, this difference was the reason I even considered the ST category!) Eventually the interest rate will go up and when it does, the ST fund’s value will drop. The worst thing one can do is to buy an ST fund today because the returns are better: you’ll be paying more than the underlying debts’ actual yield (thanks to mark to market adjustment) and when the interest rate goes up, you will end up losing money.

If the debt fund that you chose for your portfolio is an ST fund, I guess you can continue to invest in it. Your existing portfolio would have gone up now. Your returns will average out when your ST fund’s value goes down later. But entering an ST fund today just to benefit from recent higher yields is a loss making move.

If you are willing to play tactically and buy/sell based on interest rate movements, you can very well do that and capitalise on the prices going up. But tactical play really is not my thing, so I should just stick to my UST funds.

I started this enquiry with the question of whether I can do something to increase the yield of my debt investments (without taking too much risk). The answer is clear: I just have to accept low yields for the time being. Looks like there is no prudent way to make my debt portfolio give a better yield.

15 Feb 2021

Can we use Conservative Hybrid funds as the debt part of our portfolio?

 Of late, I am fascinated by mutual fund schemes that have some equity exposure, but still maintain a conservative stance prioritising low volatility over high returns. In my previous post, I compared Quantum Multi-Asset fund with ICICI Regular Savings fund. Assessing just on volatility, there’s a better fund than the ICICI fund: it’s Baroda Conservative Hybrid Fund. The fund looked so attractive to me, I started wondering if I should use this fund for the debt part of my portfolio! Allowing equity into the debt portfolio is an unnecessary risk, but the 9% return is alluring (vs the 4% that we get from more stable debt funds).

Thankfully, I am not as impulsive and dumb as I used to be, so I started thinking of ways to accommodate this fund into my portfolio. To decide what value it can add to the portfolio, I decided to look at 1 year rolling returns of the fund. To qualify as a good debt fund, the variability should be within a reasonable range. (All rolling return graphs in this post are screenshots from RupeeVest.com.)

1 year rolling returns of Baroda Conservative Hybrid fund and Nifty Next 50 index plotted on the same graph

The blue line on the graph is the Baroda fund and the black line is Nifty Next 50 index. Compared to the index, the fund is essentially a flat line, making us think that it’s been very stable. While this graph looked great, I wanted to compare it with my primary debt instrument, the L&T Ultra Short Term Debt Fund. When plotted against the pure debt fund, the variability in the return of the hybrid fund stands out more clearly. The green line (debt fund) is fairly smooth while the blue line (hybrid fund) goes up and down.

1 year rolling returns of Baroda Conservative Hybrid fund and L&T Ultra Short Term fund plotted on the same graph

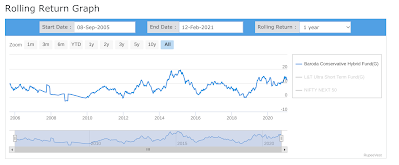
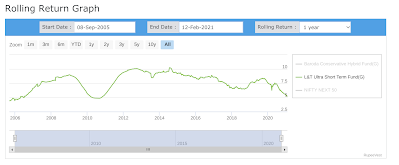
To get a better idea of the variability in these 2 funds, I also looked at them in isolation. While both funds have gone up and down in the yield curve, pay attention to the Y axis: the lowest 1 year return from the debt fund is around 4% while the lowest return from the hybrid fund is negative! The debt fund’s returns are in a range of 4 to 10% while the hybrid fund has a wider range of about -1 to almost 20%. The hybrid fund is also hovering below 5% yield far more frequently than the debt fund. Even with equity exposure, one might end up worse off than the pure debt investment.

Graph showing 1 year rolling returns of Baroda Conservative Hybrid Fund
1 year rolling returns of Baroda Conservative Hybrid Fund
Graph showing 1 year rolling returns of L&T Ultra Short Term Debt Fund
1 year rolling returns of L&T Ultra Short Term Debt Fund

Conservative Hybrid is a category that has lower volatility than other categories like pure equity, balanced advantage, etc. The Baroda fund has one of the lowest volatility numbers even within the Conservative Hybrid category. If this fund cannot add stability and predictability to a portfolio, I think no other fund in the category will. Nor any other fund category with a higher allocation to equity. 

Takeaways for me from this exercise:

  • Equity exposure, even when the allocation is less than 20%, adds variability to the amount of return you will get.
  • If you are just parking some money for a few years, an instrument with some equity exposure is probably okay. But don’t add these funds to the debt portion of your portfolio (why).
  • Current interest rates are not at all attractive, and the debt portion of my portfolio is not growing as quickly as I had expected. Simply accepting the low return is a more prudent option than investing in equities to make up for the lost interest. (In other words, don’t risk the capital in your search for more interest.)

6 Feb 2021

In search of a low volatility mutual fund

We own a house that we have rented out. The tenants pay a security deposit that we hold as long as the tenants live in our house; the deposit is returned when they move out. I was putting this money in an Ultra Short Term Debt fund thinking I’d need to take the money out any time. (Some context for the uninitiated: Ultra short term debt funds have negligible volatility, so you can redeem them pretty much any time without risking a capital loss. When you invest in more volatile instruments such as equity, you cannot simply take the money out as soon as you want.)

Later, I realised that our regular cash flow is often sufficient to return the deposit without needing to redeem the ultra short term debt investment. Armed with this new bit of information, I started looking for mutual fund schemes that have some equity exposure. I wanted the equity exposure to be low enough to keep the volatility low, even if it meant the returns are a few percentage points lower than an “optimum” investment scheme.

When it comes to mutual fund investments, I like Quantum as an AMC: they don’t take excessive risk chasing returns; they regularly conduct sessions to educate investors. I am also a big fan of Quantum Multi-Asset Fund of Funds. I recommend this fund to everyone who just wants to invest without making a list of goals as long as they can stay invested for a few years. My need aligns perfectly with this criteria: I just need a mutual fund that more or less acts like a bank FD, but gives better returns. (Yes, this is definitely not equivalent to an FD due to the inherent volatility. But I am okay if the fund value goes down a bit.)

But the trouble with choosing a mutual fund scheme is that there are so many of them to choose from! Conservative Hybrid funds seemed like a good fit for my need: they invest mere 10 to 25% in equity and invest the rest of the money in debt instruments. I looked at all available options sorting them by volatility. Of the top few options that had the least volatility, ICICI Prudential Regular Savings fund seemed like a good option. Looking at historical performance, the ICICI fund is actually better than Quantum Multi-Asset! It has given better return while remaining less volatile! This is like a dream combination.

Impressed by the ICICI fund’s historic performance, I moved on to the next step: I looked at the portfolio of the fund to see how it’s getting its returns. Before we get to the ICICI fund’s portfolio, let’s take a quick look at the Quantum fund’s portfolio:

The portfolio of the Mutli-Asset fund holds 42% in Quantum Liquid fund, and about 12% in Quantum Dynamic Bond fund. The rest is invested in equity and gold. I have seen the portfolios of the Quantum Liquid and Dynamic Bond funds; they hold mostly Sovereign debt and a small amount of AAA rated debt. This means the Quantum Multi-Asset fund is taking virtually no credit risk at all.

Now let’s look at the ICICI Regular Savings fund’s portfolio. On 31st December 2020, 82.39% of the portfolio had debt instruments. More than half of the debt portfolio, 57.8% to be precise, was debts rated AA or A! In other words, if you invest ₹1,000 in this fund, ₹476 of that money will be invested in debts rated AA and A. I was not expecting this at all.

So, ICICI Prudential Regular Savings fund is earning attractive return by taking credit risk. But you wouldn’t notice this if you just looked at past performance. The biggest dip you see in the NAV graph is in March 2020 when every fund in India lost value. (If the graph below looks too volatile to you, remember that this fund holds equity along with debt. For a fund with equity exposure, this volatility is incredibly low.)

Think about everything I have said so far. I am saying that this fund is taking a lot of credit risk. I am also saying this fund has very low volatility. How is that possible? Wouldn’t the fund see a credit event, a sharp dip in the NAV, whenever one of these risky debts default? But in the past 8 years, there’s hardly any sharp decline in NAV.

One theory I have is that ICICI is a very good lender: ICICI Bank, ICICI Home Finance, etc make all their money by lending money to customers. With their experience, maybe they have the ability to look beyond credit rating and they know how to identify quality borrowers even if they have a less than perfect credit rating. Maybe.

When it comes to investing my own money, I need to decide which one I trust more: credit ratings or ICICI’s ability to see beyond credit ratings. Neither option is risk free, so I need to choose which risk I am comfortable with. After some deliberation, I have decided that I’d stick with Quantum Multi-Asset Fund for my needs for the following reasons:

  • I am not comfortable taking credit risk. Not everyone agrees that credit ratings are accurate or useful, but that’s the best we have today.
  • The multi-asset fund is more diversified with some exposure to gold. I just like the idea of having some exposure to gold though I know that some people think gold doesn't add much to a portfolio.
  • Supporting responsible AMCs like Quantum is the right thing to do, even when they generate less returns.